
Thursday 15 January 2015 09:49, UK
With just five points separating Premier League basement boys Leicester and 12th-placed Everton, this season's relegation battle is tighter than ever.
QPR, Hull, Burnley, Sunderland, Crystal Palace, West Brom and Aston Villa are also at risk, along with Leicester and Everton, and with just 17 games remaining every match is crucial.
But which of those nine clubs invovled in the scrap are best-placed to fight their way to safety?
Here we take a thorough look at the stats, from the numbers of tackles and clearances made to shot conversion rates and passing percentages, to see where things have gone wrong for the strugglers - and which teams are showing potential for improvement...
DEFENCE
Clean sheets
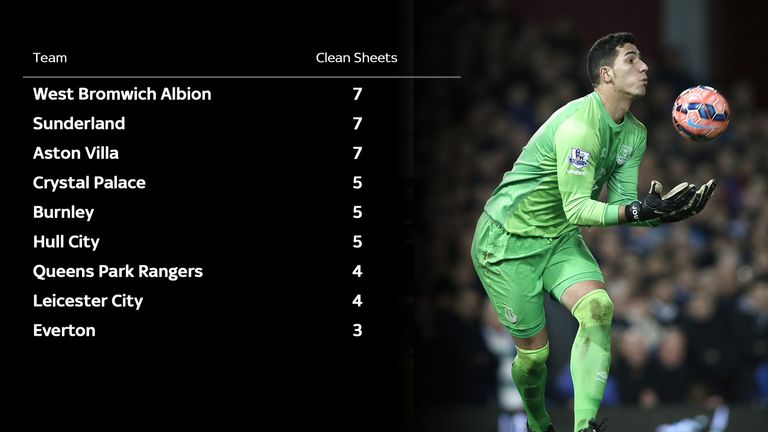
Although all in relegation trouble, three of the nine sides in question – West Brom, Sunderland and Aston Villa – have actually kept clean sheets in one third of their respective games so far this season with seven shut-outs apiece. In contrast, Everton, who prop up the table in this area, have stopped the opposition from scoring just three times– six fewer clean sheets than they had managed at this stage of last season.
Shots faced
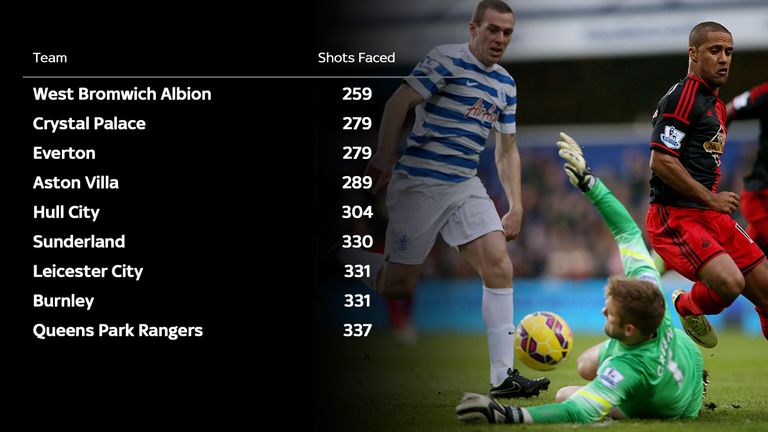
Five of the bottom nine have faced more than 300 shots against them, which averages over 14 strikes per game. QPR have had to contend with the most (337), but there’s little to choose between Harry Redknapp’s side and Burnley (331), Leicester (331) and Sunderland (330). It’s West Brom on 259 who have faced the fewest shots, ahead of Crystal Palace and Everton on 279.
Tackles made
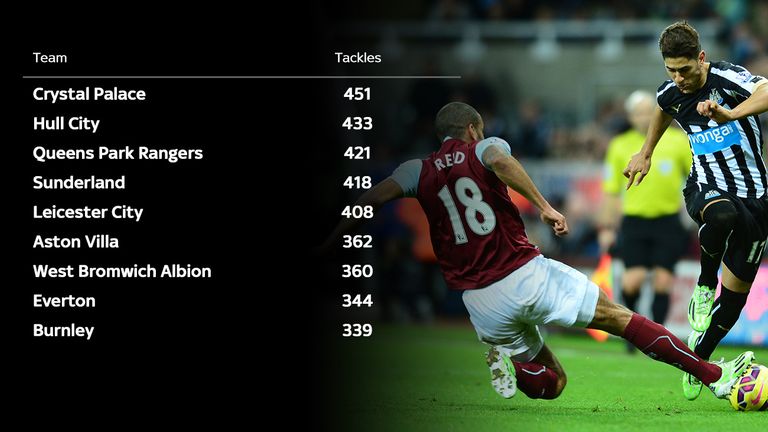
Crystal Palace have shown that they have not been afraid to get stuck in, making the most tackles (451) of any of the teams in the bottom nine. Hull City (433) and QPR (421) are not far behind but Everton (344) and Burnley (339) have both made over 100 fewer tackles than the Eagles so far.
Blocks
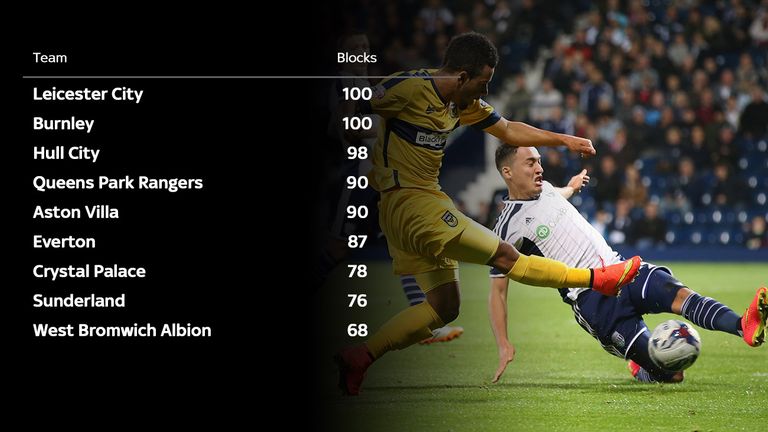
Palace may have made the most tackles of the bottom nine, but they are someway off the pace when it comes to blocks. Leicester and Burnley lead the way with their players putting their bodies on the line 100 times, just ahead of Hull (98), while Palace (78) are third from bottom in this ranking. West Bromwich Albion have made the fewest blocks this season (68, an average of just over three a game) and Sunderland are the closest to them with 76.
Shots on target faced
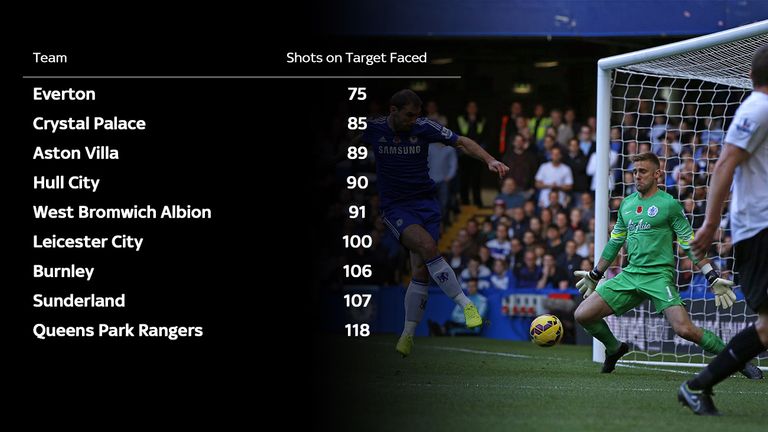
The goalkeepers at Leicester, Burnley and Sunderland have all been kept busy this season, with each club facing over 100 shots on target this term. But it is QPR shot-stopper Rob Green who has been the busiest of all the bottom nine – his goal has been peppered with 118 efforts this season. Unsurprisingly QPR have conceded the most goals in the division.
Clearances
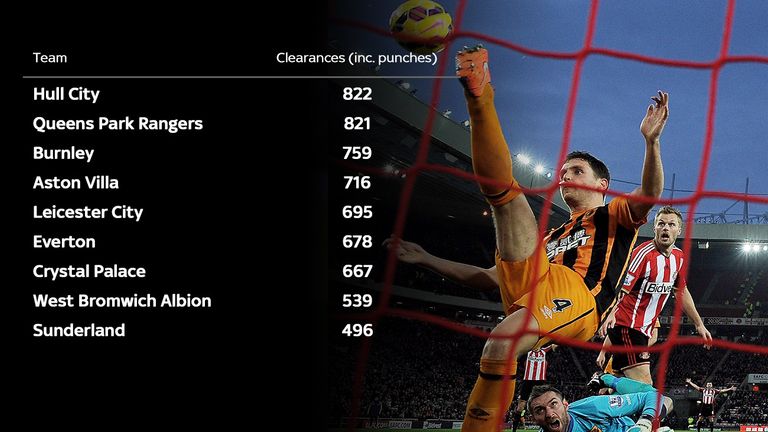
Just one clearance separates Hull (822) and QPR (821) at the top of this particular table, with both struggling sides averaging nearly 40 clearances per game as they fight to get out of the relegation zone. Sunderland, by contrast, have made just 496 clearances in their 21 matches.
ATTACK
Goals
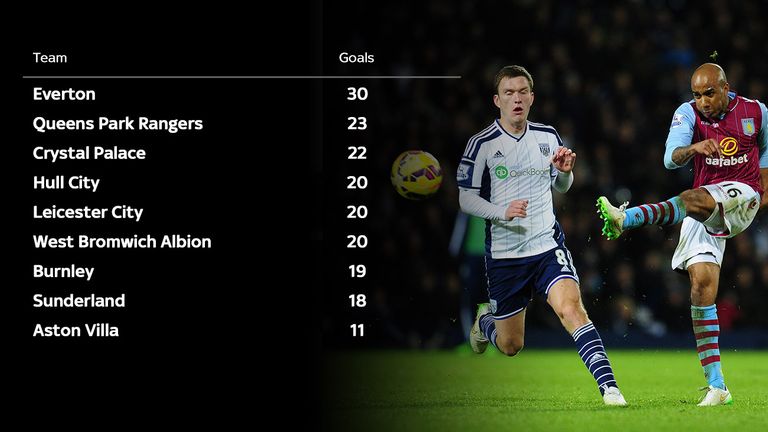
Goals might win matches but the points totals of Everton and Aston Villa show that scoring bucket loads is not the be-all and end-all. Both sides sit on 22 points in the Premier League, despite Everton (30) netting 19 more goals than Villa (11) this season. QPR and Palace (both 23) are the nearest challengers to Everton while Sunderland (18) and Burnley (19) are in the bottom three with Villa.
Total shots
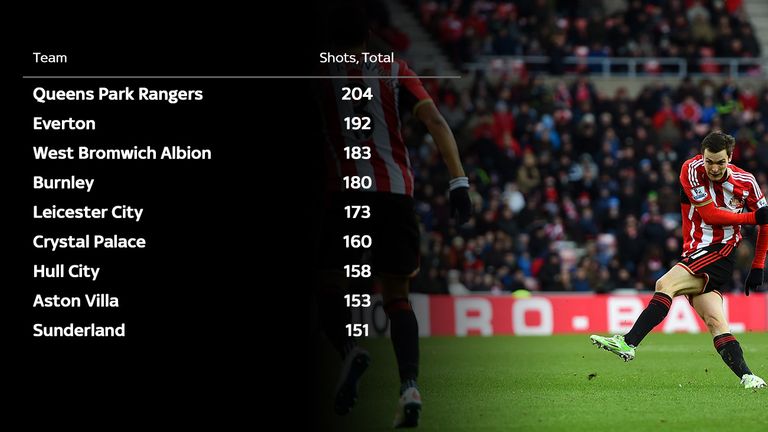
It’s little surprise to see that QPR (204) and Everton (192) are top of the shooting charts, having also led the way in the scoring so far this season. Villa, despite netting only 11 times, have actually had a couple more shots (153) than Sunderland (151), but still have a far worse shots-to-goals ratio of 13.9. With 183 and 180 shots respectively, West Bromwich Albion and Burnley have the worst shots-to-goals ratios behind Villa, with WBA averaging 9.15 shots per goal and Burnley 9.4
Shots on target
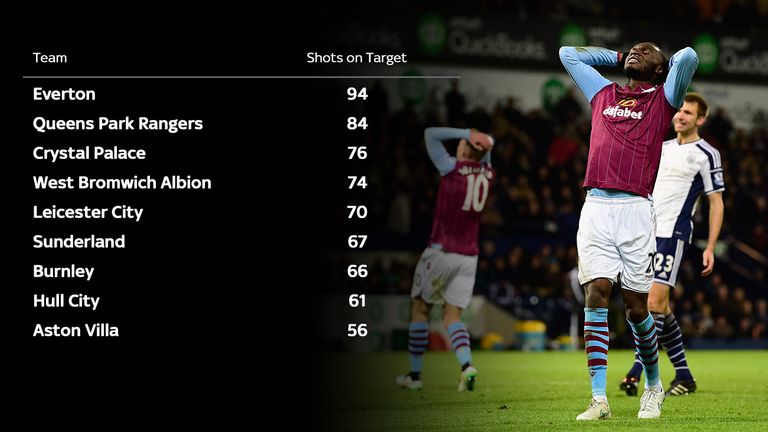
Given they have scored seven more goals than any other team currently in the bottom nine of the table, it’s no shock to see Everton lead the way on shots on target with 94. That is 10 more than the next best, QPR, and amazingly nearly 40 more than Aston Villa, who prop up the table with just 56 shots from their 21 games. The stark difference between Everton and Villa’s statistics isn’t reflected in the Premier League table - they are currently tied on 22 points.
Shooting accuracy
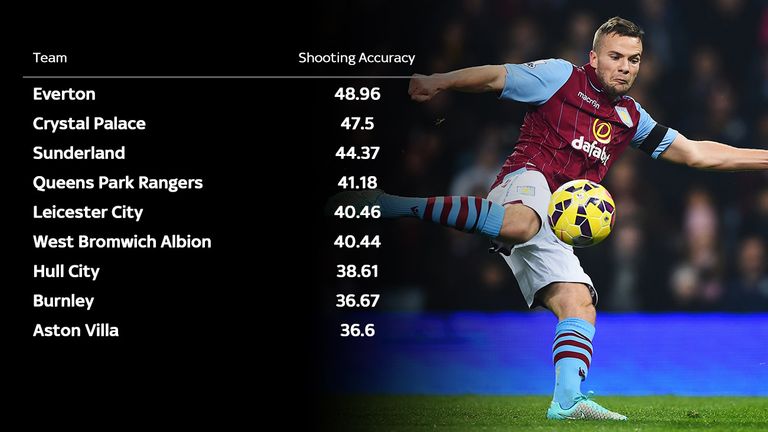
Aston Villa sit bottom of the pile when it comes to goals scored and their players have been the most wayward when it comes to the shooting accuracy stats. Just 36.6 per cent of their shots have found the target this term. Burnley (36.67) and Hull (38.61) have fared little better, but even Everton – who lead the bottom nine clubs in this category – have only managed to test the opposition ‘keeper with 48.96 per cent of their strikes.
Shot conversion rate
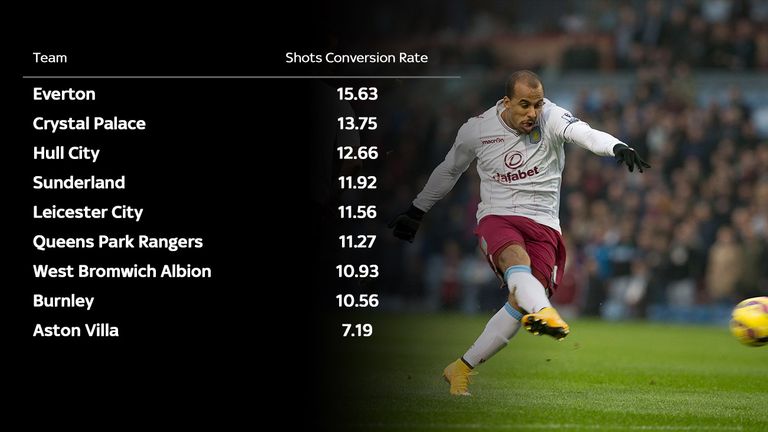
With Paul Lambert’s side desperately short of goals, Aston Villa’s cause is not helped by the side's paltry conversion rate – just 7.19 per cent of their shots have found the net so far this season. Everton’s strike rate is more than double that (15.63 per cent), with Crystal Palace (13.75) and Hull City (12.66) next up. In fact, Villa are the only side to have scored with fewer than 10 per cent of their shots so far this campaign.
Passing accuracy
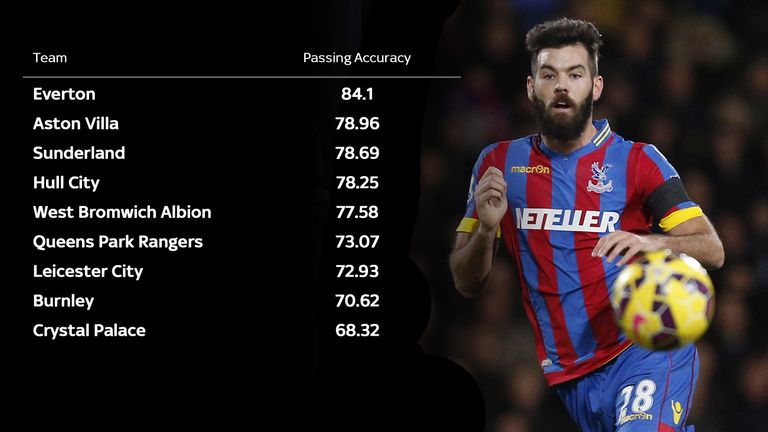
Everton are the clear leaders when it comes to passing accuracy, with their table-topping 84.1 per cent putting them well ahead of Aston Villa (78.96) and Sunderland (78.69). Hull City are not far behind in fourth (78.25) but Crystal Palace (68.32) players have often struggled to pick out a team-mate and are the only team with less than 70 per cent accuracy. Only slightly better than the Eagles are Burnley (70.62) and Leicester (72.93).
Passes in opposition half
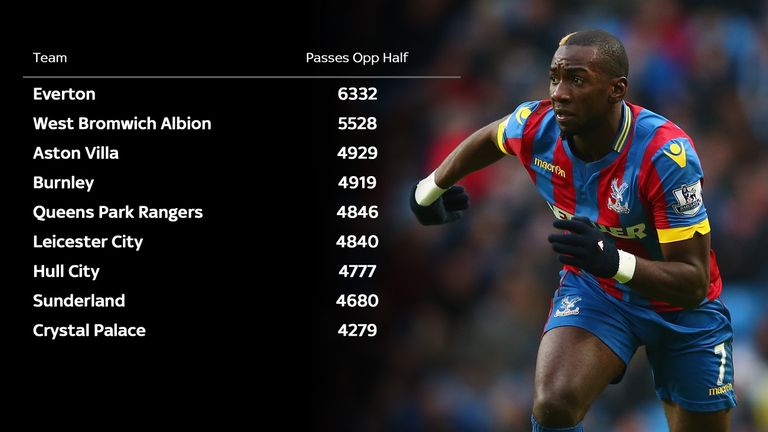
With Roberto Martinez at the helm, Everton are always going to do well on passing statistics and they comfortably lead this particular category. As one of eight teams in the league to have scored 30 or more goals, their total of 6,332 passes in the opposition’s half reflects their attacking instincts. West Brom, another side who have gained a reputation for good football in recent times, are a comfortable second on the list (5,528 passes) ahead of Aston Villa (4,929) and Burnley (4,919). At the bottom of the table are Crystal Palace, who have strung together just 4,279 passes in the opposition’s half so far this season.
Possession
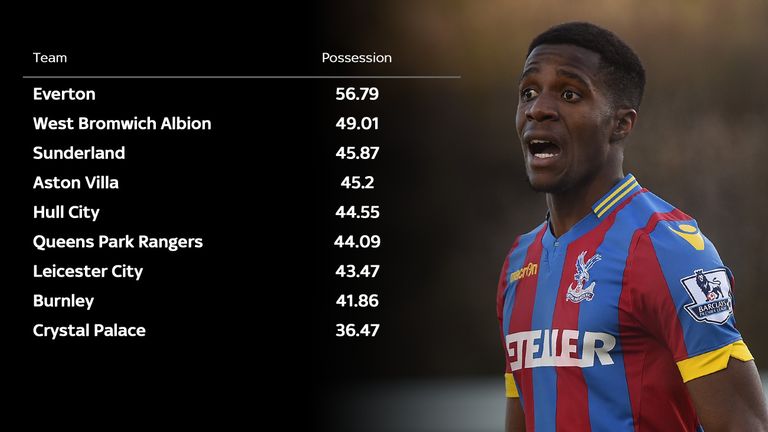
It’s a facet of their game that has drawn some criticism this season, so it’s not surprising that Everton are top of the possession charts with 56.79 per cent. None of the other bottom nine have managed to hit the 50 per cent mark, with West Brom in second (49.01) and Sunderland in third (45.87). Palace are again adrift at the bottom with 36.47 per cent, with Burnley (41.86) and Leicester (43.47) just ahead of Alan Pardew’s side.